


Herman Legal Group · Original data analysis
Ohio Immigration & Population Report 2026
International migration helped eight Ohio counties grow despite other population losses
What the Ohio data show
International migration helped eight Ohio counties grow despite losses from their other population changes. Another 20 counties still shrank: international gains were not enough to cover their other losses. Other changes combine births minus deaths, moves within the United States, and the Census residual adjustment.
This report compares every Ohio county using one Census release. Its contribution is a reproducible set of county comparisons, an explanation of the population accounting, and downloadable tables and charts. It is designed for journalists, community organizations, educators, employers, and people trying to understand local demographic change.
- 59 counties grew; 29 declined. Ohio’s statewide gain therefore masks substantial local variation.
- 65 counties had more deaths than births. A negative natural-change balance can coexist with overall growth when migration offsets it.
- 71 counties had positive net international migration. A positive international balance alone does not establish that a county grew.
- Ohio gained 39,889 residents overall. Net international migration was +28,505, equivalent to 71.5% of the net statewide gain.
The 71.5% figure divides one population component by the final net change. It is an accounting ratio, not an estimate of immigration’s causal impact. Ohio’s other components added a net 11,384 residents, so the statewide accounting does not show a negative balance without the international component.
Source for all report calculations: HLG analysis of the U.S. Census Bureau’s CO-EST2025-ALLDATA file, Vintage 2025, released March 2026. Accessed October 11, 2026.
Ohio grew as international migration slowed
Ohio’s population estimate rose from 11,860,621 on July 1, 2024, to 11,900,510 on July 1, 2025. That increase of 39,889 was smaller than the previous annual gain of 52,231 in the same Census vintage.
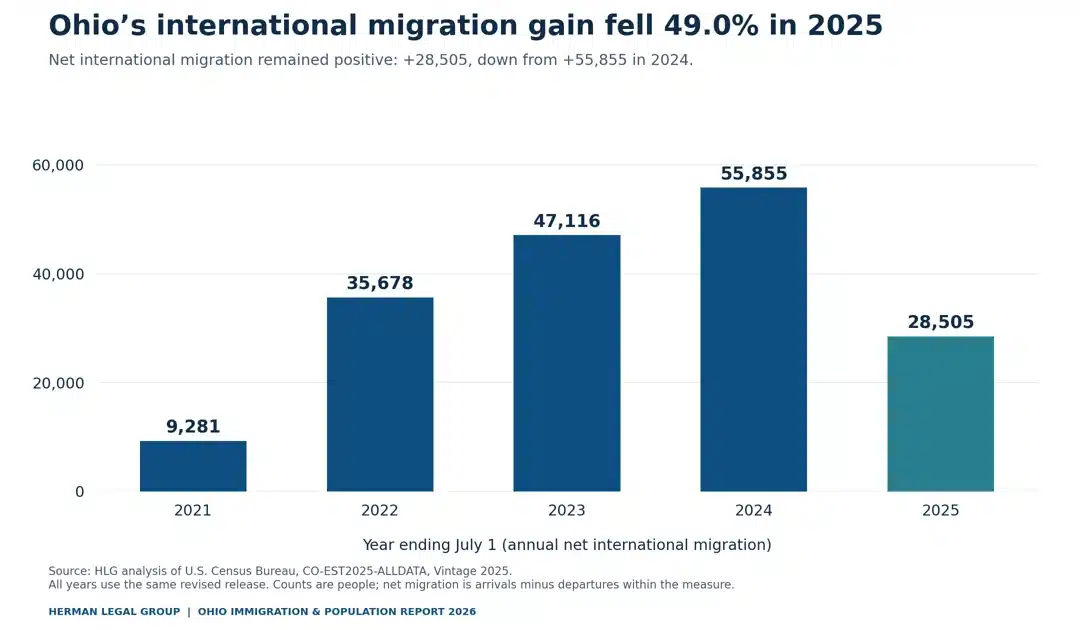
Net international migration fell from 55,855 to 28,505, a decline of 27,350, or 49.0%. At the same time, Ohio’s domestic migration balance shifted from −1,339 to +11,926. Births still fell short of deaths, but the natural decrease narrowed from 1,360 to 729. These components moved in different directions; the smaller international gain is only part of the statewide story.
| Component (people) | 2024 | 2025 |
|---|---|---|
| Net international migration | +55,855 | +28,505 |
| Net domestic migration | -1,339 | +11,926 |
| Natural change: births minus deaths | -1,360 | -729 |
| Residual adjustment | -925 | +187 |
| Total population change | +52,231 | +39,889 |
A net measure combines movements in both directions. A lower net international gain does not mean that only 28,505 people arrived, nor that the number of arrivals fell by exactly 49.0%. These figures also do not identify which policy, labor-market change, or family decision produced the difference.
Using a single vintage matters. The Census Bureau revises earlier estimates with each annual release. A number in an older news story may have been accurate for that release yet differ from the revised series used here. Compare like with like before describing a trend.
Ohio and the nation: what declined?
Ohio: annual net international migration fell 49.0%. The balance declined from 55,855 in July 2023-June 2024 to 28,505 in July 2024-June 2025, or 27,350 fewer net additions. Calculation: (28,505 – 55,855) / 55,855. Ohio still gained people through international migration. This is not a 49.0% decrease in Ohio’s foreign-born population.
The figures below describe the United States, not Ohio. This report does not estimate a decline in Ohio’s foreign-born resident population. The national survey figures are context only and are not inputs to the 88-county analysis.
Annual migration flow fell 53.8%
Net international migration fell from 2,734,468 in July 2023-June 2024 to 1,262,202 in July 2024-June 2025: 1,472,266 fewer net additions, a 53.8% decrease. Both estimates use Census Vintage 2025. The balance remained positive: international migration still added people, but more slowly.
Foreign-born population: estimated 2.6% decrease
Separately, Census reports that the Current Population Survey estimated 53.3 million foreign-born residents in January 2025 and 51.9 million in June 2025. That is approximately 1.4 million fewer people, or 2.6% over the interval, calculated as (51.9 – 53.3) / 53.3 using rounded published values. This is not an annualized rate or a count of confirmed departures.
How certain is the population decrease?
Census cautions that changes in survey response, coverage error and population controls can affect the foreign-born comparison. The 2.6% is a descriptive change between survey estimates, not a demonstrated statistically significant decline. It is separate national context, not an input to the county classifications. Foreign-born includes naturalized U.S. citizens and noncitizens; it excludes people who were U.S. citizens at birth.
What can we say about Trump’s second term?
Trump began his second term on January 20, 2025. The annual migration comparison spans the end of the Biden administration and approximately the first five months of the Trump administration. The January-June survey comparison overlaps the transition but is not an exact inauguration-day baseline. Neither comparison isolates the effects of particular policies or measures the full period since Trump took office.
Does this include international workers and students?
Yes. International migration includes temporary migrants such as resident workers and students, as well as permanent immigrants, humanitarian migrants and undocumented residents. It also includes certain movements of U.S. citizens, Puerto Rico migration and overseas Armed Forces movements. It measures population movement, not visa issuance or tourist entries. The atlas cannot separate the decline by visa category.
National context sources: Census explanation, January 27, 2026; Census population definitions. Accessed October 11, 2026. Ohio calculations use the preserved Census Vintage 2025 source.
Eight growing counties had losses in their other components
Athens, Franklin, Hamilton, Huron, Lake, Portage, Sandusky, and Wyandot counties meet the same three conditions: positive total population change, positive net international migration, and a negative combined balance for natural change, domestic migration, and the residual.
| County | International migration | Other components | Total change |
|---|---|---|---|
| Athens | +209 | -92 | +117 |
| Franklin | +9,441 | -561 | +8,880 |
| Hamilton | +3,032 | -2,473 | +559 |
| Huron | +52 | -30 | +22 |
| Lake | +267 | -190 | +77 |
| Portage | +412 | -215 | +197 |
| Sandusky | +61 | -57 | +4 |
| Wyandot | +64 | -56 | +8 |
Franklin had the largest international gain in this group: +9,441. Its other components summed to −561, leaving total growth of 8,880. Hamilton’s international gain of 3,032 offset a larger negative balance of −2,473 from the other components, leaving growth of 559.
The same pattern appeared at a much smaller scale elsewhere. Sandusky’s international gain was 61, its other components totaled −57, and its net population gain was just four. Wyandot gained eight overall; Huron gained 22. Small positive totals deserve particular care because later estimate revisions can change a county’s category.
How to describe this finding: “International migration offset losses from other population components in eight growing Ohio counties in 2025.” The subtraction shows the components of the published estimate. It does not predict what those counties would have experienced under a different immigration policy.
Twenty counties declined despite international gains
A second group illustrates why migration and total growth should be reported separately. In 20 counties, a positive international migration balance reduced the size of a negative total population change. Their other components were sufficiently negative that the final balance remained below zero.
The 20 counties: Allen, Ashtabula, Auglaize, Clark, Cuyahoga, Erie, Fayette, Fulton, Jefferson, Lucas, Mahoning, Monroe, Ottawa, Paulding, Pike, Preble, Richland, Scioto, Seneca, Washington.
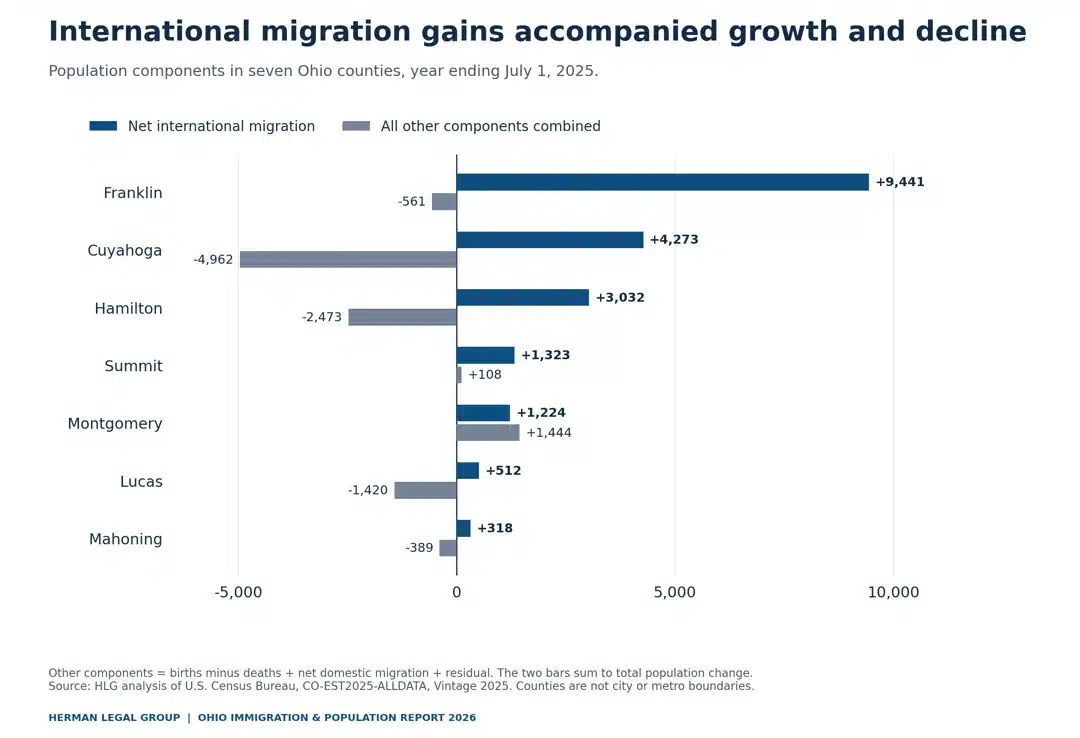
Cuyahoga is the clearest large-county example. Net international migration added 4,273 to its population accounting, while the other components totaled −4,962. The result was a decline of 689. Lucas had an international gain of 512 and other components of −1,420, producing a decline of 908. Mahoning’s international gain of 318 narrowed its net decline to 71.
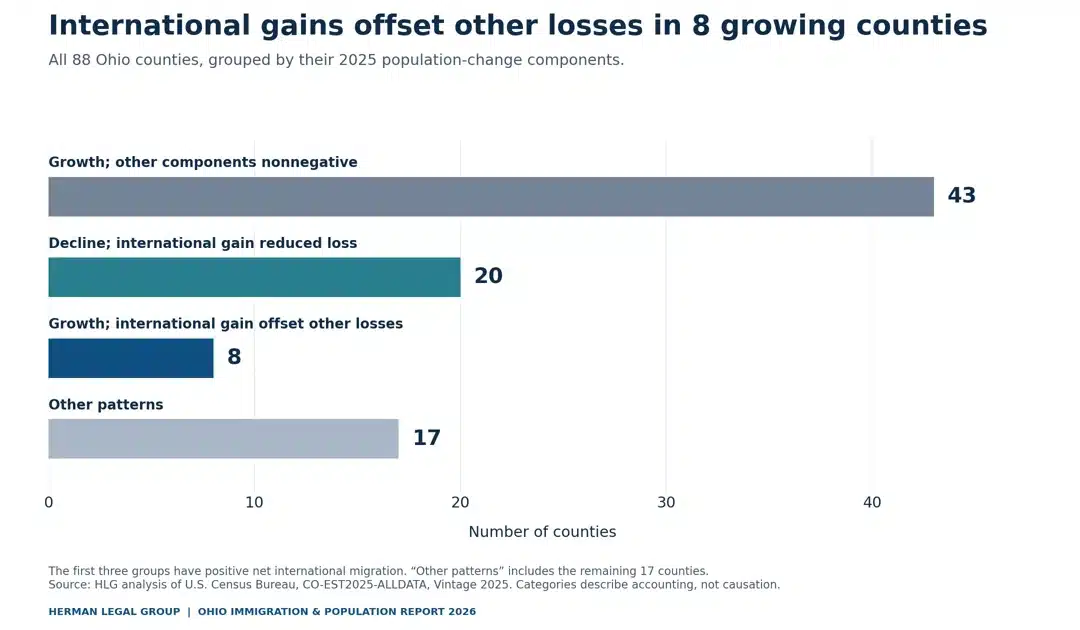
The remaining 43 counties with positive international migration also grew, and their other components were nonnegative. This distinction prevents the report from treating every growing county as having the same demographic pattern. The complete county table below includes all 88 counties, including the 17 outside the first three categories.
Seven county spotlights
These comparisons use county boundaries. Cuyahoga County is not the City of Cleveland; Franklin County is not the full Columbus metropolitan area. The city references below orient readers geographically without substituting one boundary for another.
Cuyahoga County: international gains narrowed a decline
The county containing Cleveland lost 689 residents overall. Its +4,273 international migration balance was outweighed by a natural decrease of 777 and net domestic outmigration of 4,235, with a residual of +50. A positive international balance and a negative total balance are both true.
Franklin County: Ohio’s largest international gain
The county containing Columbus recorded +9,441 net international migration, the largest county total in Ohio. Natural increase added 6,591, but domestic migration was −7,191. Including the +39 residual, the other components totaled −561; overall growth was 8,880.
Hamilton County: a small net gain from large opposing flows
The county containing Cincinnati gained 559 residents. International migration of +3,032 and natural increase of +2,159 were partly offset by domestic migration of −4,650. The residual was +18. The small total conceals much larger movements within the accounting.
Montgomery County: two positive combined balances
The county containing Dayton gained 2,668 residents. International migration contributed +1,224, while the other components added +1,444. Domestic migration of +1,659 outweighed a natural decrease of 242; the residual was +27.
Summit County: international migration made up most of the net gain
The county containing Akron gained 1,431 residents. Net international migration was +1,323, and the other components combined were +108. Domestic migration of +972 offset a natural decrease of 889, with a +25 residual. Summit therefore belongs in the group where both combined balances were nonnegative.
Lucas County: positive international migration, net population loss
The county containing Toledo lost 908 residents. Its international gain of 512 partly offset domestic migration of −1,324 and natural change of −109. A residual of +13 brings the other components to −1,420.
Mahoning County: migration gains almost balanced natural decrease
The county containing Youngstown had a natural decrease of 959. Domestic migration of +569 and international migration of +318, plus a residual of +1, left a net population decline of 71. Its positive migration balances did not quite offset the births-and-deaths balance.
All 88 Ohio counties: population and migration table
Find a county alphabetically or use your browser’s Find command. The table contains every county in the source; no search or sign-in is required. Download the CSV or workbook for natural change, domestic migration, residuals, 2024 comparisons, and population-adjusted international migration rates.
| County | Population July 1, 2025 | International migration | Other components | Total change | Pattern |
|---|---|---|---|---|---|
| Adams | 27,865 | +30 | +193 | +223 | Both balances nonnegative |
| Allen | 100,881 | +92 | -163 | -71 | Reduced net decline |
| Ashland | 52,523 | +24 | +64 | +88 | Both balances nonnegative |
| Ashtabula | 96,713 | +31 | -66 | -35 | Reduced net decline |
| Athens | 63,197 | +209 | -92 | +117 | Offset other losses |
| Auglaize | 45,909 | +8 | -35 | -27 | Reduced net decline |
| Belmont | 64,434 | -2 | -328 | -330 | Other pattern |
| Brown | 44,397 | +12 | +222 | +234 | Both balances nonnegative |
| Butler | 400,128 | +1,711 | +636 | +2,347 | Both balances nonnegative |
| Carroll | 26,475 | -1 | -91 | -92 | Other pattern |
| Champaign | 38,820 | +8 | +95 | +103 | Both balances nonnegative |
| Clark | 135,340 | +281 | -1,111 | -830 | Reduced net decline |
| Clermont | 216,977 | +207 | +2,456 | +2,663 | Both balances nonnegative |
| Clinton | 42,301 | +63 | +192 | +255 | Both balances nonnegative |
| Columbiana | 99,377 | -13 | -286 | -299 | Other pattern |
| Coshocton | 37,188 | +9 | +180 | +189 | Both balances nonnegative |
| Crawford | 41,896 | +51 | +305 | +356 | Both balances nonnegative |
| Cuyahoga | 1,232,925 | +4,273 | -4,962 | -689 | Reduced net decline |
| Darke | 51,520 | +10 | +65 | +75 | Both balances nonnegative |
| Defiance | 38,292 | -3 | -38 | -41 | Other pattern |
| Delaware | 242,032 | +945 | +4,224 | +5,169 | Both balances nonnegative |
| Erie | 73,296 | +150 | -499 | -349 | Reduced net decline |
| Fairfield | 169,752 | +197 | +1,849 | +2,046 | Both balances nonnegative |
| Fayette | 28,552 | +7 | -164 | -157 | Reduced net decline |
| Franklin | 1,361,536 | +9,441 | -561 | +8,880 | Offset other losses |
| Fulton | 41,853 | +32 | -254 | -222 | Reduced net decline |
| Gallia | 29,072 | -2 | +118 | +116 | Other pattern |
| Geauga | 95,676 | +6 | +370 | +376 | Both balances nonnegative |
| Greene | 174,322 | +254 | +1,920 | +2,174 | Both balances nonnegative |
| Guernsey | 38,379 | +9 | +41 | +50 | Both balances nonnegative |
| Hamilton | 838,418 | +3,032 | -2,473 | +559 | Offset other losses |
| Hancock | 75,034 | +178 | +95 | +273 | Both balances nonnegative |
| Hardin | 30,072 | -2 | -180 | -182 | Other pattern |
| Harrison | 14,070 | -1 | -28 | -29 | Other pattern |
| Henry | 27,598 | +25 | +68 | +93 | Both balances nonnegative |
| Highland | 43,823 | +1 | +118 | +119 | Both balances nonnegative |
| Hocking | 27,512 | -3 | +55 | +52 | Other pattern |
| Holmes | 44,970 | +11 | +216 | +227 | Both balances nonnegative |
| Huron | 58,250 | +52 | -30 | +22 | Offset other losses |
| Jackson | 32,817 | +14 | +62 | +76 | Both balances nonnegative |
| Jefferson | 63,597 | +12 | -283 | -271 | Reduced net decline |
| Knox | 64,002 | +64 | +374 | +438 | Both balances nonnegative |
| Lake | 232,217 | +267 | -190 | +77 | Offset other losses |
| Lawrence | 55,710 | -21 | -226 | -247 | Other pattern |
| Licking | 185,564 | +245 | +979 | +1,224 | Both balances nonnegative |
| Logan | 46,302 | +14 | +216 | +230 | Both balances nonnegative |
| Lorain | 323,219 | +322 | +1,738 | +2,060 | Both balances nonnegative |
| Lucas | 423,347 | +512 | -1,420 | -908 | Reduced net decline |
| Madison | 46,985 | +16 | +1,181 | +1,197 | Both balances nonnegative |
| Mahoning | 224,706 | +318 | -389 | -71 | Reduced net decline |
| Marion | 65,115 | -2 | +240 | +238 | Other pattern |
| Medina | 185,025 | +183 | +567 | +750 | Both balances nonnegative |
| Meigs | 21,587 | -3 | +28 | +25 | Other pattern |
| Mercer | 42,737 | +52 | +165 | +217 | Both balances nonnegative |
| Miami | 112,634 | +88 | +674 | +762 | Both balances nonnegative |
| Monroe | 12,994 | +6 | -79 | -73 | Reduced net decline |
| Montgomery | 539,598 | +1,224 | +1,444 | +2,668 | Both balances nonnegative |
| Morgan | 13,626 | 0 | +21 | +21 | Other pattern |
| Morrow | 36,305 | +3 | +294 | +297 | Both balances nonnegative |
| Muskingum | 87,014 | +23 | +670 | +693 | Both balances nonnegative |
| Noble | 14,276 | -2 | +14 | +12 | Other pattern |
| Ottawa | 39,481 | +23 | -271 | -248 | Reduced net decline |
| Paulding | 18,727 | +53 | -83 | -30 | Reduced net decline |
| Perry | 35,918 | +3 | +210 | +213 | Both balances nonnegative |
| Pickaway | 62,978 | +4 | +767 | +771 | Both balances nonnegative |
| Pike | 27,061 | +4 | -19 | -15 | Reduced net decline |
| Portage | 163,404 | +412 | -215 | +197 | Offset other losses |
| Preble | 40,664 | +1 | -55 | -54 | Reduced net decline |
| Putnam | 34,380 | +39 | +181 | +220 | Both balances nonnegative |
| Richland | 124,893 | +40 | -104 | -64 | Reduced net decline |
| Ross | 76,429 | -1 | +432 | +431 | Other pattern |
| Sandusky | 58,655 | +61 | -57 | +4 | Offset other losses |
| Scioto | 71,365 | +28 | -487 | -459 | Reduced net decline |
| Seneca | 54,522 | +45 | -217 | -172 | Reduced net decline |
| Shelby | 48,065 | +9 | +104 | +113 | Both balances nonnegative |
| Stark | 373,771 | +176 | +355 | +531 | Both balances nonnegative |
| Summit | 538,376 | +1,323 | +108 | +1,431 | Both balances nonnegative |
| Trumbull | 198,972 | -23 | -819 | -842 | Other pattern |
| Tuscarawas | 92,373 | +101 | +40 | +141 | Both balances nonnegative |
| Union | 73,446 | +117 | +1,346 | +1,463 | Both balances nonnegative |
| Van Wert | 29,013 | +23 | +124 | +147 | Both balances nonnegative |
| Vinton | 12,645 | 0 | +88 | +88 | Other pattern |
| Warren | 257,181 | +944 | +1,198 | +2,142 | Both balances nonnegative |
| Washington | 58,389 | +12 | -222 | -210 | Reduced net decline |
| Wayne | 116,758 | +169 | +14 | +183 | Both balances nonnegative |
| Williams | 36,549 | 0 | -72 | -72 | Other pattern |
| Wood | 134,176 | +211 | +893 | +1,104 | Both balances nonnegative |
| Wyandot | 21,567 | +64 | -56 | +8 | Offset other losses |
Pattern key: “Offset other losses” means international migration was positive, other components were negative, and total change was positive. “Reduced net decline” means international migration was positive but total change was negative. “Both balances nonnegative” means international migration was positive and other components were nonnegative, with positive total change. “Other pattern” covers all remaining counties.
Counts are people; migration figures are net flows. Other components = births minus deaths + net domestic migration + residual. The international and other-components columns sum to total change. All values use Vintage 2025.
What these findings can help communities ask
The value of the county comparison is that it separates different local questions. A county with natural decrease and positive domestic migration has a different accounting pattern from one with natural increase and domestic outmigration. International migration can be relevant in both, but the numbers do not support a single explanation for every place.
- For local reporters: Start with the county’s complete component balance, then seek local evidence about housing, schools, employers, and community services. Those additional sources are needed to explain why people move or what changes mean locally.
- For chambers and employers: Use population trends as a starting point for a workforce discussion. This dataset does not measure working-age population, job openings, skills, wages, or employment.
- For universities and community organizations: Use the downloadable county rows to compare places consistently. The data do not identify students, refugees, visa categories, citizenship, or legal status.
- For policy discussions: Keep the descriptive result separate from a policy claim. The accounting can identify where international migration was positive; it cannot evaluate the effect of a particular enforcement or admissions policy.
For related research and commentary, see HLG’s Immigration & the Economy hub and Richard Herman’s response to Joel Kotkin on depopulation. This report supplies the county-level demographic comparison; those resources discuss the broader civic and economic debate.
For the Cleveland policy implications, read Richard Herman’s Cleveland’s census debate and immigrant growth strategy. The commentary connects population loss with newcomer retention, immigrant entrepreneurship and City Hall accountability. This report’s migration figures do not identify immigration status.
Methodology, definitions, and reproducibility
Source and coverage
HLG analyzed the U.S. Census Bureau’s Population Estimates Program file CO-EST2025-ALLDATA, Vintage 2025, released in March 2026. We selected Ohio using state FIPS code 39, kept the statewide record (summary level 040) for comparison, and analyzed all 88 county records (summary level 050). The source was accessed October 11, 2026.
“2026” identifies this report edition, not the year of population change. Population stocks are July 1 estimates. The annual components labeled 2025 cover July 1, 2024 through June 30, 2025. The 2024 components cover the preceding annual period. The five-year chart uses the annual periods ending July 1, 2021 through July 1, 2025, all from the same Vintage 2025 file.
How the population components fit together
Natural change is births minus deaths. Net domestic migration is the balance of moves within the United States into and out of a county. Net international migration includes movements of foreign-born and U.S.-born people, flows between the United States and Puerto Rico, and movements of the Armed Forces between the United States and overseas. Residual is the adjustment needed to reconcile the component series with total population change.
The international migration measure is a flow, not the number of immigrants living in a county. It is not a count of undocumented residents, new permanent residents, visa approvals, or border encounters. It cannot be used to assign an immigration status to a county’s population.
Calculations
- Other components: natural change + net domestic migration + residual, also equal to total change minus net international migration.
- International migration year-over-year change: (2025 value ÷ 2024 value − 1) × 100. A zero prior-year denominator is unavailable. Percentage comparisons involving a negative prior-year balance can be misleading; use the underlying counts.
- International migration per 1,000 residents: 2025 net international migration ÷ the average of the July 1, 2024 and July 1, 2025 populations × 1,000.
- International share of statewide net growth: 28,505 ÷ 39,889 × 100 = 71.5%, rounded to one decimal. This ratio can exceed 100% in places where other components are negative.
Quality checks
The analysis confirmed 88 unique county records, reconciled the population difference and component identities for every Ohio record for 2021–2025, and checked that county sums matched the statewide value for 40 field-year combinations. The county categories are mutually exclusive and cover all 88 records. The downloadable workbook preserves the source fields and exposes the calculations.
Limits and revisions
These are population estimates, not a new census enumeration. This report does not calculate confidence intervals or statistical significance. Small changes and rankings can shift when estimates are revised. The analysis describes geographic population accounting; it does not isolate a causal effect, forecast a world with different migration, or measure 2026 developments. County results must not be relabeled as city or metropolitan-area results.
A future edition should rerun the complete analysis from the next Census vintage, preserve this edition’s files, and explain revisions. Comparing values from different vintages without identifying the revision can create an apparent trend that mixes methodological changes with demographic change.
Primary sources
- U.S. Census Bureau: County Population Totals and Components of Change, 2020–2025. Release page and vintage information.
- CO-EST2025-ALLDATA: original national data file (CSV). Original source values used in this analysis.
- CO-EST2025-ALLDATA file layout (PDF). Field definitions, periods, and release date.
- Vintage 2025 population estimates methodology (PDF). Census estimation methods.
The research package preserves the original national CSV, the Ohio-only source extract, the analytical CSV, a data dictionary, calculation scripts, and a checksum for the source file.
Questions about the findings
Did international migration help Ohio’s population grow in 2025?
Net international migration was +28,505 in Ohio’s 2025 population accounting. Total population growth was 39,889, and the other components combined added 11,384. International migration was a large positive component, but the state also had a positive balance from the other components.
Which Ohio counties grew while their other population components were negative?
Athens, Franklin, Hamilton, Huron, Lake, Portage, Sandusky, and Wyandot. In all eight, positive net international migration exceeded the net population gain, offsetting a negative combined balance from natural change, domestic migration, and the residual.
Did Cuyahoga County grow in 2025?
No. In Census Vintage 2025, Cuyahoga County lost 689 residents in the year ending July 1, 2025. Its +4,273 international migration balance partly offset −4,962 from the other components. These are county results, not City of Cleveland estimates.
Which county had Ohio’s largest net international migration gain?
Franklin County, at +9,441 in 2025. It was followed by Cuyahoga (+4,273), Hamilton (+3,032), Butler (+1,711), and Summit (+1,323). These are counts, not population-adjusted rates.
Does the report count undocumented immigrants?
No. The international migration variable is an aggregate population flow and does not identify legal status. The report also does not measure the foreign-born population already living in each county.
Why does a 2026 report use 2025 population estimates?
The edition year is 2026. The underlying county population release is Census Vintage 2025, released in March 2026. Its latest population stock is July 1, 2025; the latest annual components end on that date.
Can I use the data and cite an individual county?
Yes. Download the county CSV or workbook and cite this report together with the U.S. Census Bureau, Vintage 2025. Retain the county boundary, period, and distinction between net international migration and total population change. Chart downloads include source credits.
Cite this report and download the data
The figures and tables are supplied to make the analysis easier to check and cite. No registration is required. Keep the source credit and period with a chart so readers can trace its numbers.
Herman, Richard T. Ohio Immigration & Population Report 2026: An 88-County Atlas of International Migration and Population Change. Herman Legal Group working paper. Published October 13, 2026. Analysis of U.S. Census Bureau, Population Estimates Program, Vintage 2025. Data accessed October 11, 2026.
Suggested chart credit: Herman Legal Group analysis of U.S. Census Bureau, Vintage 2025. When publishing online, please link to the report so readers can inspect the methodology and download the underlying data.
- Full report (PDF)
- All 88 counties (CSV)
- Research workbook with calculations and source values (XLSX)
- Data dictionary (CSV)
- Three charts in PNG, PNG, and WebP formats (ZIP)
For media questions or to flag a data issue, contact Richard Herman. Please include the county name, field, year, and source when reporting a discrepancy.
Author and affiliation
Richard T. Herman, Esq. is an immigration attorney with more than 30 years of practice, founder of Herman Legal Group in Cleveland, Ohio, and co-author of Immigrant, Inc. His legal practice and writing address immigration and immigrant entrepreneurship.
This working paper is affiliated with Herman Legal Group. AI tools assisted with drafting, coding and checks; source data and calculation scripts are provided for independent verification. The paper has not undergone independent peer review.
Compare Ohio with the national picture
Explore the U.S. Immigration & Population Atlas 2026 for all 3,144 counties and county equivalents, using the same Census vintage and classification rules.